
KNOWLEDGE · HOSTuvo

Build a repeatable analysis process

Sessions, macro and catalysts. CVD, L2, absorption and liquidity.

48 articles8 categories

CATEGORIES

Choose an area.

ALL MATERIALS

Full library.

How to analyze the market crypto from scratch: process instead of guessing
Academy4 min read

How to analyze the market crypto from scratch: process instead of guessing

A good analysis starts with the order of questions, not with the search for an indicator that will confirm our expectations. First, we define the market regime and horizon, then the structure, Timing, flow and cost of performance. The process should separate observation from the decision. The same stroke can be interesting in 15 minutes and at the same time do not change the structure of 4h/1d. Only a match...

  • First, define the context and horizon of the analysis.
  • Confirm your applications with independent data layers.
  • Take into account the quality of feed, spread and real cost of execution.
Read more
Trend, Range or Chaos? How to recognize the market regime
Academy4 min read

Trend, Range or Chaos? How to recognize the market regime

The same technical signal is of different importance in a stable trend, in a tight range and during a rapid change of conditions. Therefore, the first task of an analyst is to name the environment in which he works. The trend is characterized by a structured sequence of winds and relatively consistent directional pressure. Range requires more attention to the edges of the range, and chaos or transition means that...

  • First, define the context and horizon of the analysis.
  • Confirm your applications with independent data layers.
  • Take into account the quality of feed, spread and real cost of execution.
Read more
Why one indicator almost never enough
Academy4 min read

Why one indicator almost never enough

The indicator is a transformation of data, not a separate source of truth. RSI, MACD whether the rolling average describes the selected price characteristics, but does not mention liquidity, order flow, positioning and performance costs. If several indicators are derived from the same price, their compatibility can only be apparent. True independent layers come from other data families: order flow,...

  • First, define the context and horizon of the analysis.
  • Confirm your applications with independent data layers.
  • Take into account the quality of feed, spread and real cost of execution.

Read more
Multi-timeframe: how to connect 5m, 15m, 1h, 4h and 1D
Academy4 min read

Multi-timeframe: how to connect 5m, 15m, 1h, 4h and 1D

Different intervals do not compete with each other. Everyone answers another question: 1D and 4h show context and structure, 1h helps to observe the transition, and 5–15m can be used to evaluate short timing. The most important is to set the hierarchy. A brief impulse should not automatically delete the swing plan, and a long-term trend does not give the right to ignore local risk of entry after too...

  • First, define the context and horizon of the analysis.
  • Confirm your applications with independent data layers.
  • Take into account the quality of feed, spread and real cost of execution.

Read more
HOLD It's also a decision: when the best transaction is the lack of transactions
Academy4 min read

HOLD It's also a decision: when the best transaction is the lack of transactions

No entry does not mean no analysis. If the data is conflicting, the cost is too high or the structure does not give room for a reasonable plan, decision HOLD protects the process from forced activity. The market does not offer conditions that meet the quality, Timing and feasibility criteria for a large part of time. The system, which always generates the action, usually also produces a lot of...

  • First, define the context and horizon of the analysis.
  • Confirm your applications with independent data layers.
  • Take into account the quality of feed, spread and real cost of execution.

Read more
The Asian Session, London and New York — what really differ
Market sessions4 min read

The Asian Session, London and New York — what really differ

The crypto works 24/7, but the liquidity and market participants are not evenly uniform around the clock. Asia, London and New York can create different profiles of variation, volume and response to levels. Asia is more likely to build a range or continue to move local with less liquidity, London brings European capital and New York puts macro data and US instruments on the market...

  • First, define the context and horizon of the analysis.
  • Confirm your applications with independent data layers.
  • Take into account the quality of feed, spread and real cost of execution.
Read more
Opening the U.S. to crypto: Why 3:30 can change the whole day
Market sessions4 min read

Opening the U.S. to crypto: Why 3:30 can change the whole day

The opening of the US stock market increases institutional activity and can transfer new information from indices, dollar and bonds to the cryptocurrency market. Therefore, the surrounding area of 15:30 Polish time requires additional attention. The most important thing is whether the pre-opening movement is confirmed by an increased volume or quickly negated. It is also important to have a correlation with Nasdaq,...

  • First, define the context and horizon of the analysis.
  • Confirm your applications with independent data layers.
  • Take into account the quality of feed, spread and real cost of execution.
Read more
Weekend on cryptocurrency — Why Liquidity Behaviors Different
Market sessions4 min read

Weekend on cryptocurrency — Why Liquidity Behaviors Different

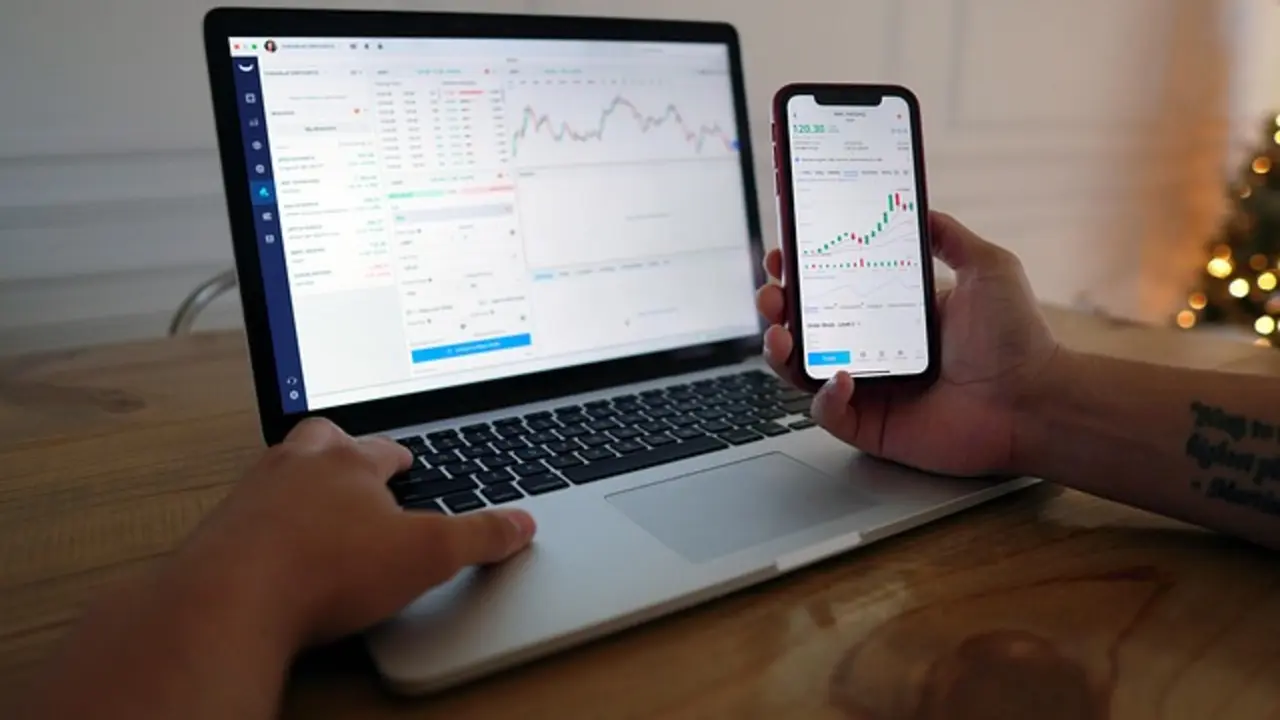
The cryptocurrency market does not close on weekend, but some participants in traditional markets are inactive. This can lower depth, change spread and make smaller order flows move the price more than a week. Weekend traffic can be real, but its durability is worth assessing only after the return of greater liquidity. Sunday nights and Monday nights are especially important...

  • First, define the context and horizon of the analysis.
  • Confirm your applications with independent data layers.
  • Take into account the quality of feed, spread and real cost of execution.
Read more
How to prepare for a new market session
Market sessions4 min read

How to prepare for a new market session

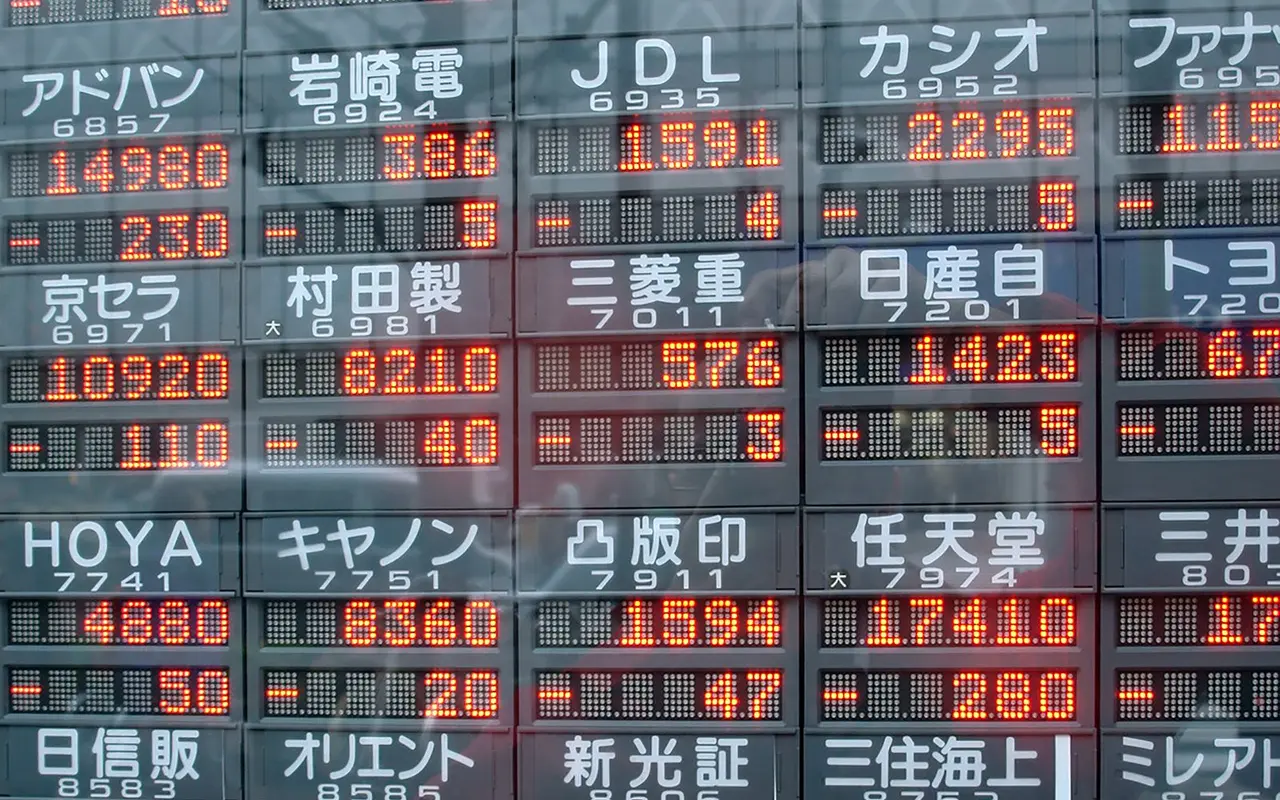
Good preparation before the session reduces the number of decisions taken under pressure. Instead of responding to each candle, it is worth defining in advance the levels, scenarios and data that will change the market assessment. The session plan should include a context of 4h/1d, the scope of the previous session, the closest high/low swing, important events, the current spread and a list of instruments with sufficient liquidity. It is a...

  • First, define the context and horizon of the analysis.
  • Confirm your applications with independent data layers.
  • Take into account the quality of feed, spread and real cost of execution.
Read more
When the move from Asia has a chance to survive during the European session
Market sessions4 min read

When the move from Asia has a chance to survive during the European session

The movement started in Asia does not need to be negated in Europe, but its quality depends on the structure and participation. The best question is not "will London reverse?" but "will new liquidity accept the prices built earlier?". Continuation is more credible when the strike has closures outside the earlier range, the turnover grows, and the return to the level does not cause aggressive...

  • First, define the context and horizon of the analysis.
  • Confirm your applications with independent data layers.
  • Take into account the quality of feed, spread and real cost of execution.

Read more
CPI inflation a Bitcoin — what the market really appreciates
Macros and Events4 min read

CPI inflation a Bitcoin — what the market really appreciates

The CPI publication affects expectations about interest rates and central bank policies, so it can trigger a rapid change in risk valuation. However, the inflation number itself is less important than the difference in consensus. The market responds to surprise and how the publication changes the expected path of monetary policy. The same reading could cause a different reaction in two different...

  • First, define the context and horizon of the analysis.
  • Confirm your applications with independent data layers.
  • Take into account the quality of feed, spread and real cost of execution.

Read more
Fed decisions and interest rates: How they affect crypto
Macros and Events4 min read

Fed decisions and interest rates: How they affect crypto

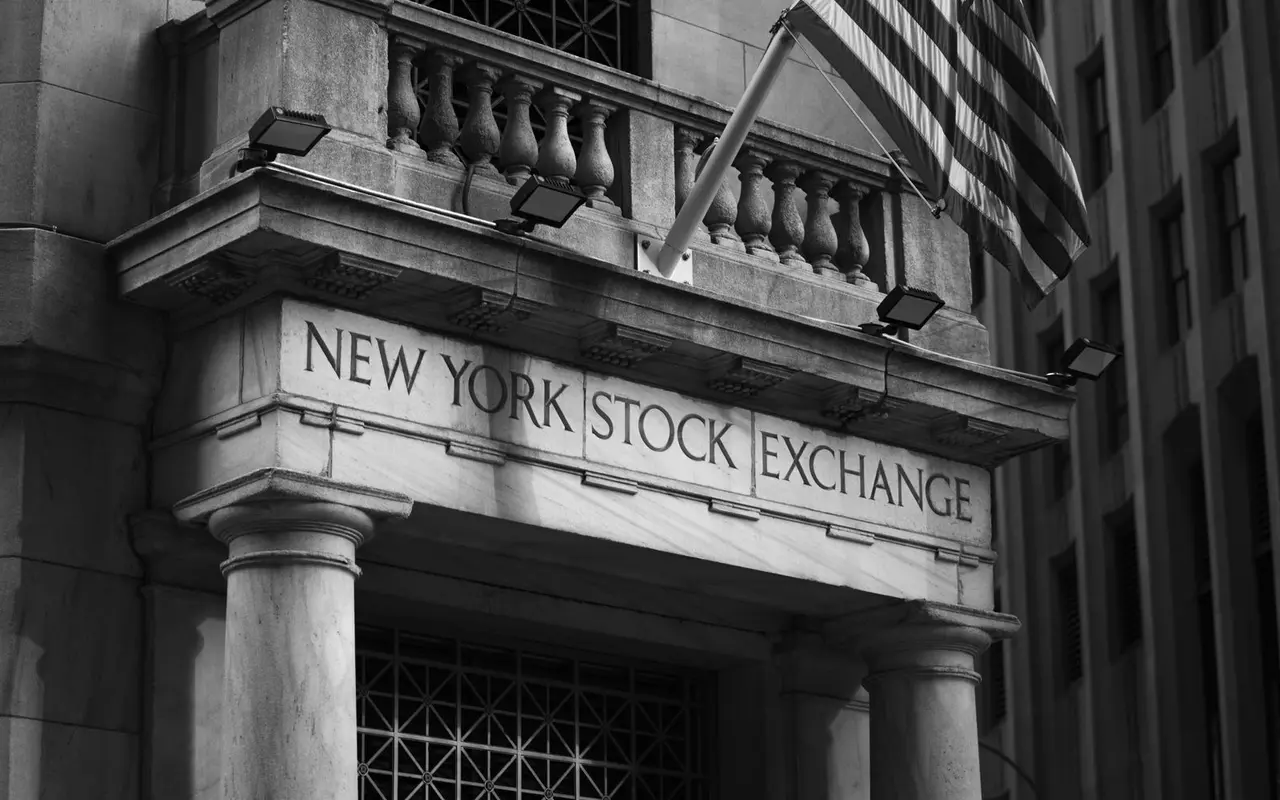
Fed affects money price, liquidity and expectations of risk assets. To code, not only the interest rate decision itself, but the message, projections and conference that change expectations for the future. The market often evaluates the decision before it is announced. Therefore, no change of feet can cause a lot of traffic if the language of the message differs from expectations. BTC It's...

  • First, define the context and horizon of the analysis.
  • Confirm your applications with independent data layers.
  • Take into account the quality of feed, spread and real cost of execution.
Read more
DXY Dollar, bonds and Bitcoin — how to read dependency
Macros and Events4 min read

DXY Dollar, bonds and Bitcoin — how to read dependency

DXY and bond yields are often used as a context for risky assets, but correlations are not permanent. In different regimes Bitcoin may react more strongly to liquidity, crypto events or specific flows than the dollar itself. Stronger dollar is the opposite wind for risk, and rising real profitability increases the attractiveness of assets without risk. However, this does not mean...

  • First, define the context and horizon of the analysis.
  • Confirm your applications with independent data layers.
  • Take into account the quality of feed, spread and real cost of execution.
Read more
ETF Bitcoin and Ethereum: Flows more important than headlines
Macros and Events4 min read

ETF Bitcoin and Ethereum: Flows more important than headlines

ETFs create a channel of capital flow between the traditional financial system and the exposure to crypto. For the market, the actual balance of inflows and outflows and the price response to these flows can be more important than the media headline. A large inflow does not have to immediately raise prices if the supply of the spot absorbs demand. In turn, moderate flows can have a greater effect during a period of thin liquidity....

  • First, define the context and horizon of the analysis.
  • Confirm your applications with independent data layers.
  • Take into account the quality of feed, spread and real cost of execution.

Read more
Unlocks tokens — When Supply Can Really Threaten the Price
Macros and Events4 min read

Unlocks tokens — When Supply Can Really Threaten the Price

Unlock increases the number of tokens that can enter the market, but not every unblocked unit goes straight to the market. The importance of the event depends on size relative to capitalization and liquidity, the structure of beneficiaries and prior positioning. A large percentage of the supply unlocked for early investors or the team can increase the risk of sales pressure. On the other hand...

  • First, define the context and horizon of the analysis.
  • Confirm your applications with independent data layers.
  • Take into account the quality of feed, spread and real cost of execution.
Read more
Support and Resistance Without Guessing: How to Set Important Levels
Price Action4 min read

Support and Resistance Without Guessing: How to Set Important Levels

The level of support or resistance is not a single ideal price. This is an area where demand and supply have previously changed significantly, either activity has increased or the market has repeatedly reacted. The most important are the levels seen at the higher interval, the limits of the well defined range, the earlier high/low swing and the place of the large volume. The more independent reasons, the more...

  • First, define the context and horizon of the analysis.
  • Confirm your applications with independent data layers.
  • Take into account the quality of feed, spread and real cost of execution.
Read more
Breakout or fakeout? How to distinguish a bump from a trap
Price Action4 min read

Breakout or fakeout? How to distinguish a bump from a trap

The impact is valuable when the market accepts prices outside the earlier range. The wick itself over resistance or rapid leap on a small volume is not enough, as it can only be a collection of liquidity and a return to the middle of the range. Search for closures outside the structure, increase participation and behavior during the retest. If the price quickly returns to the level of the mint, and the aggression of buyers does not give...

  • First, define the context and horizon of the analysis.
  • Confirm your applications with independent data layers.
  • Take into account the quality of feed, spread and real cost of execution.

Read more
Double Bottom and Double Top — When Formation Matters
Price Action4 min read

Double Bottom and Double Top — When Formation Matters

The formation is important when two tests of an important zone show a change in market ability to continue, and the structure between tests gives a clear point of confirmation. In Double Bottom, we are not only interested in the second hole, but whether the sales pressure is weakening, whether absorption is emerging and whether the price is recovering local swing. Similarly...

  • First, define the context and horizon of the analysis.
  • Confirm your applications with independent data layers.
  • Take into account the quality of feed, spread and real cost of execution.
Read more
Bull Flag and Bear Flag — How to Rate Continuity of Movement
Price Action4 min read

Bull Flag and Bear Flag — How to Rate Continuity of Movement

The flag is a structure of consolidation after the impulse that may precede the continuation, but only if the previous move was qualitative and correction does not destroy its structure. The parallel channel itself on the chart is not enough. In Bull Flag we are looking for an orderly correction less moment than the impulse, maintaining key levels and returning demand when trying to break out. Bear Flag works...

  • First, define the context and horizon of the analysis.
  • Confirm your applications with independent data layers.
  • Take into account the quality of feed, spread and real cost of execution.
Read more
Compression of variation: what often happens before a large movement
Price Action4 min read

Compression of variation: what often happens before a large movement

Compression means a decline in traffic range and often collecting orders on both sides of the market. However, it does not tell you which direction the expansion will take. Its value is that the current state may be unstable. It can be observed by narrowing Bollinger, decline ATR, tight range, decreasing traffic spread between swings and order density. It is important whether compression accompanied...

  • First, define the context and horizon of the analysis.
  • Confirm your applications with independent data layers.
  • Take into account the quality of feed, spread and real cost of execution.

Read more
Order Flow From scratch: what happens under the candle
Order Flow4 min read

Order Flow From scratch: what happens under the candle

The candle shows the result of the transaction at a given time, but does not directly show who initiated the trade and where the liquidity was located. Order flow tries to describe this layer of process using a transaction and ordersheet. Aggressive buyer takes the available ask offer and aggressive seller hits the bid. If a large aggression does not move prices, absorption may occur; if a small...

  • First, define the context and horizon of the analysis.
  • Confirm your applications with independent data layers.
  • Take into account the quality of feed, spread and real cost of execution.
Read more
CVD — what shows and why it may differ from the price
Order Flow4 min read

CVD — what shows and why it may differ from the price

Cumulative Volume Delta accumulates the difference between aggressive buying and selling. This shows which page initiates transactions more often, but does not say in itself whether this aggression effectively moves the price. The price can rise at a weak CVDif the supply is thin or stand still with a strong positive CVDIf a big seller absorbs buyers, the discrepancy is...

  • First, define the context and horizon of the analysis.
  • Confirm your applications with independent data layers.
  • Take into account the quality of feed, spread and real cost of execution.
Read more
Absorption: When aggressive buyers can't raise the price
Order Flow4 min read

Absorption: When aggressive buyers can't raise the price

Absorption occurs when a large influx of aggressive orders encounters sufficient fluidity on the other side, making the price shift less than the scale of aggression would suggest. This is a diagnostic signal with hidden passive strength of the side. With positive delta resistance without progress, the price may suggest supply, and with the support of strong sales aggression without further decline may indicate demand....

  • First, define the context and horizon of the analysis.
  • Confirm your applications with independent data layers.
  • Take into account the quality of feed, spread and real cost of execution.
Read more
Delta Footprint — How to Read the Advantage of Buyers and Sellers
Order Flow4 min read

Delta Footprint — How to Read the Advantage of Buyers and Sellers

The Footprint spreads the volume inside the candle into price levels and shows where aggressive transactions were concentrated. Delta helps to see the imbalance, but does not say whether this imbalance has been accepted by the market. Especially interesting are clusters with extremes, stacked impalances and situations where a very large delta does not cause continuation. It is a place where you can...

  • First, define the context and horizon of the analysis.
  • Confirm your applications with independent data layers.
  • Take into account the quality of feed, spread and real cost of execution.
Read more
Whale Walls and big orders — a signal or a trap?
Order Flow4 min read

Whale Walls and big orders — a signal or a trap?

A large wall in the order book attracts attention because it suggests a considerable liquidity on one side. The problem is that the waiting order is not a transaction and can disappear a second before contacting the price. The importance of the wall grows if it remains stable when approaching the price, it is partially realized and after it is touched there is a clear reaction. The size itself is without the time of life and...

  • First, define the context and horizon of the analysis.
  • Confirm your applications with independent data layers.
  • Take into account the quality of feed, spread and real cost of execution.
Read more
Order Book L2 — how to read the depth of the market
Liquidity and microstructure4 min read

Order Book L2 — how to read the depth of the market

Order Book L2 shows visible orders waiting for subsequent price levels. This allows to evaluate the current depth, asymmetry of bid/asc/asc and potential cost of execution of larger orders. The most important is not the total number of orders, but their distribution and stability over time. The shallow market with a large gap between levels can move rapidly even with moderate...

  • First, define the context and horizon of the analysis.
  • Confirm your applications with independent data layers.
  • Take into account the quality of feed, spread and real cost of execution.
Read more
Spoofing and False Walls — Why Order Book Can Lie
Liquidity and microstructure4 min read

Spoofing and False Walls — Why Order Book Can Lie

Spoofing involves making large orders without real intent to perform them to influence the perception of liquidity. In practice, a large wall can appear, move with price and disappear before implementation. You cannot reliably recognize the spoofing from a single snapshot. You need a lifetime of the order, a cancellation frequency, a price-contact behavior and a comparison with...

  • First, define the context and horizon of the analysis.
  • Confirm your applications with independent data layers.
  • Take into account the quality of feed, spread and real cost of execution.

Read more
Spread and slippage — hidden cost of each transaction
Liquidity and microstructure4 min read

Spread and slippage — hidden cost of each transaction

The price on the chart is not always the price at which the order can be executed. Spread is the difference between bid and ask, and slippage describes the deterioration of the execution when the order consumes the available liquidity or the market moves quickly. Even a good setup may lose sense if the expected traffic is small compared to the cost of entry and exit. The problem grows on less liquid pairs, during the publication...

  • First, define the context and horizon of the analysis.
  • Confirm your applications with independent data layers.
  • Take into account the quality of feed, spread and real cost of execution.
Read more
Liquidation Cascade — How Liquidation Accelerates the Move of Price
Liquidity and microstructure4 min read

Liquidation Cascade — How Liquidation Accelerates the Move of Price

In the market with levers, the price drop can trigger forced closing of longs and the growth can eliminate shorts. These orders are aggressive and can create self-propelled movement, especially with thin liquidity. The helmet often starts after breaking the level at which a lot of positions have been accumulated. The volume increase, the OI jump or its steep drop and the fast price shift can...

  • First, define the context and horizon of the analysis.
  • Confirm your applications with independent data layers.
  • Take into account the quality of feed, spread and real cost of execution.
Read more
Liquidity Sweep — Why the price often takes away the stop of the loss before moving
Liquidity and microstructure4 min read

Liquidity Sweep — Why the price often takes away the stop of the loss before moving

Stop the fates and waiting orders focus around obvious high/low swings. Short breach of such level can run a large number of orders, provide liquidity and end up quickly returning to the earlier range. Liquidity sweet is recognized not by the wick itself, but by the reaction: rapid rejection, recovery of the level, change of the delta or absorption may suggest that...

  • First, define the context and horizon of the analysis.
  • Confirm your applications with independent data layers.
  • Take into account the quality of feed, spread and real cost of execution.

Read more
Open Interest: what he says about market position
Derivatives4 min read

Open Interest: what he says about market position

Open Interest The increase of the OI means an influx of new positions, and the decrease of their closure or liquidation, but the OI itself does not say which side is right. The rising price together with the OI may indicate the building of the exposure, while the sharp increase in the price at the falling OI often accompanies the closing of the shorts. The interpretation also depends on the foundation and...

  • First, define the context and horizon of the analysis.
  • Confirm your applications with independent data layers.
  • Take into account the quality of feed, spread and real cost of execution.

Read more
Funding Rate — When the crowd becomes too one-sided
Derivatives4 min read

Funding Rate — When the crowd becomes too one-sided

Funding keeps the price perpetual close to the spot market through periodic payments between longs and shorts. A positive pounding means longs pay shorts and negatives the opposite, but its amount must be assessed against the instrument's history. Extreme pounding may indicate unilateral positioning and susceptibility to squeeze. But it does not mean that the reversal will happen immediately; strong...

  • First, define the context and horizon of the analysis.
  • Confirm your applications with independent data layers.
  • Take into account the quality of feed, spread and real cost of execution.

Read more
Long/Short Ratio — Why Most Are Not Always Right
Derivatives4 min read

Long/Short Ratio — Why Most Are Not Always Right

Long/Short Ratio shows the proportion of accounts or positions on both sides of the market, but methodologies vary between stock exchanges. The mere advantage of long-terms does not mean that more capital is set to increase. Small accounts can dominate in numbers while the higher nominal value is on the other side. Therefore, the ratio is worth reading together with the OI, the pounding and the price change, as well as knowing...

  • First, define the context and horizon of the analysis.
  • Confirm your applications with independent data layers.
  • Take into account the quality of feed, spread and real cost of execution.

Read more
OI + Funding + price: how to read these three data together
Derivatives4 min read

OI + Funding + price: how to read these three data together

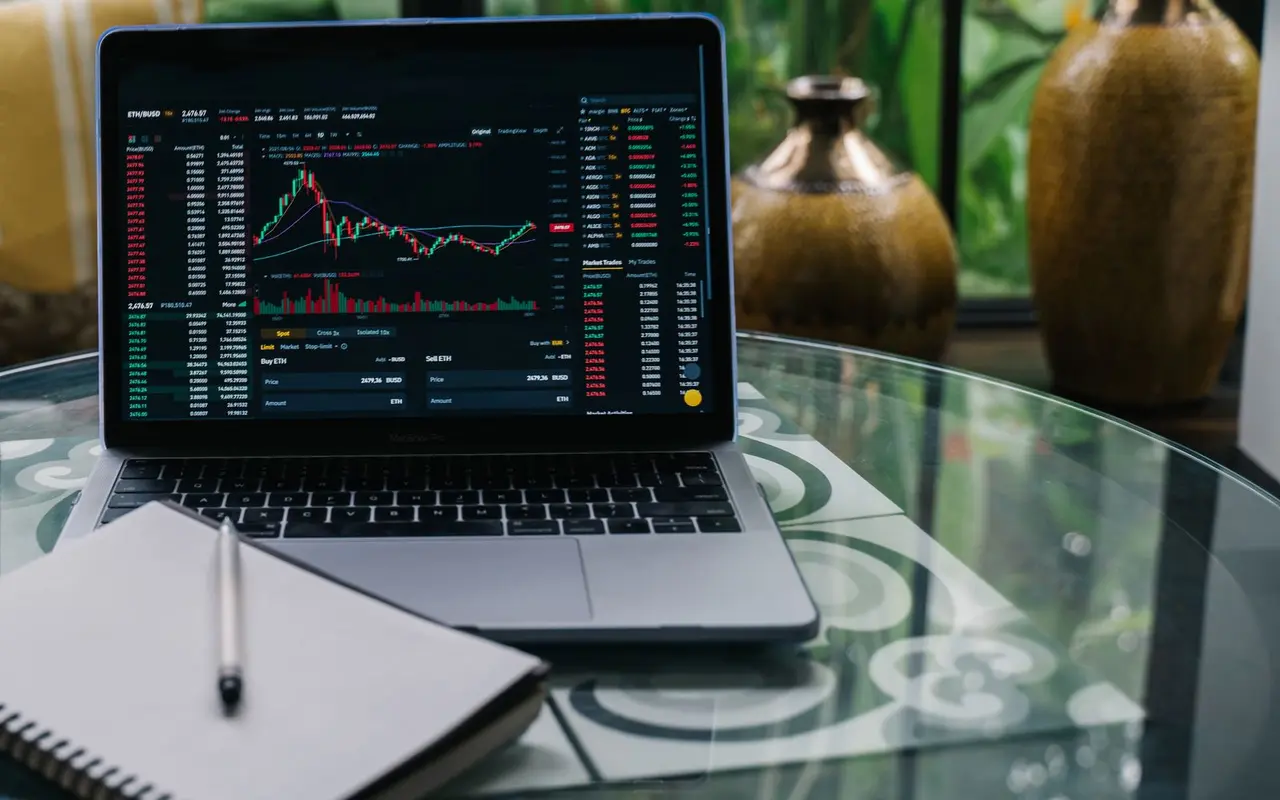
Price combination, Open Interest and the foundation allows you to better understand whether movement arises through new positions, their closure or change the cost of maintaining the exposure. None of the three elements should be interpreted separately. Price up + OI up + pounding up suggests an influx of longs, but increases the risk of congestion. Price up + OI down more often indicates closing shorts....

  • First, define the context and horizon of the analysis.
  • Confirm your applications with independent data layers.
  • Take into account the quality of feed, spread and real cost of execution.
Read more
Short squeeze and long squeeze — How violent movements arise
Derivatives4 min read

Short squeeze and long squeeze — How violent movements arise

Squeeze appears when one-sided positioning is forced to close, and these orders further drive traffic. Short squeeze strengthens growth, and long squeeze decreases, especially when fluidity is thin. Typical ingredients are high OI, extreme pounding or long/short, important technical level and sudden price expansion. After breaking the alloys and levels of forced liquidation...

  • First, define the context and horizon of the analysis.
  • Confirm your applications with independent data layers.
  • Take into account the quality of feed, spread and real cost of execution.

Read more
How It Works PRE-MOVE And what should not be drawn from it
HOSTuvo Lab4 min read

How It Works PRE-MOVE And what should not be drawn from it

PRE-MOVE is a layer of early diagnostics, which is designed to notice that market dynamics is beginning to change before traffic becomes obvious on the main chart. This is not an automatic purchase or sales signal. The engine watches horizons 5, 15, 30 and 90 minutes and a set of features of moment, flow, variation and context. The candidate passes the additional Precision GateWho...

  • First, define the context and horizon of the analysis.
  • Confirm your applications with independent data layers.
  • Take into account the quality of feed, spread and real cost of execution.

Read more
How It Works Spring Scanner And what is the extreme minimum
HOSTuvo Lab4 min read

How It Works Spring Scanner And what is the extreme minimum

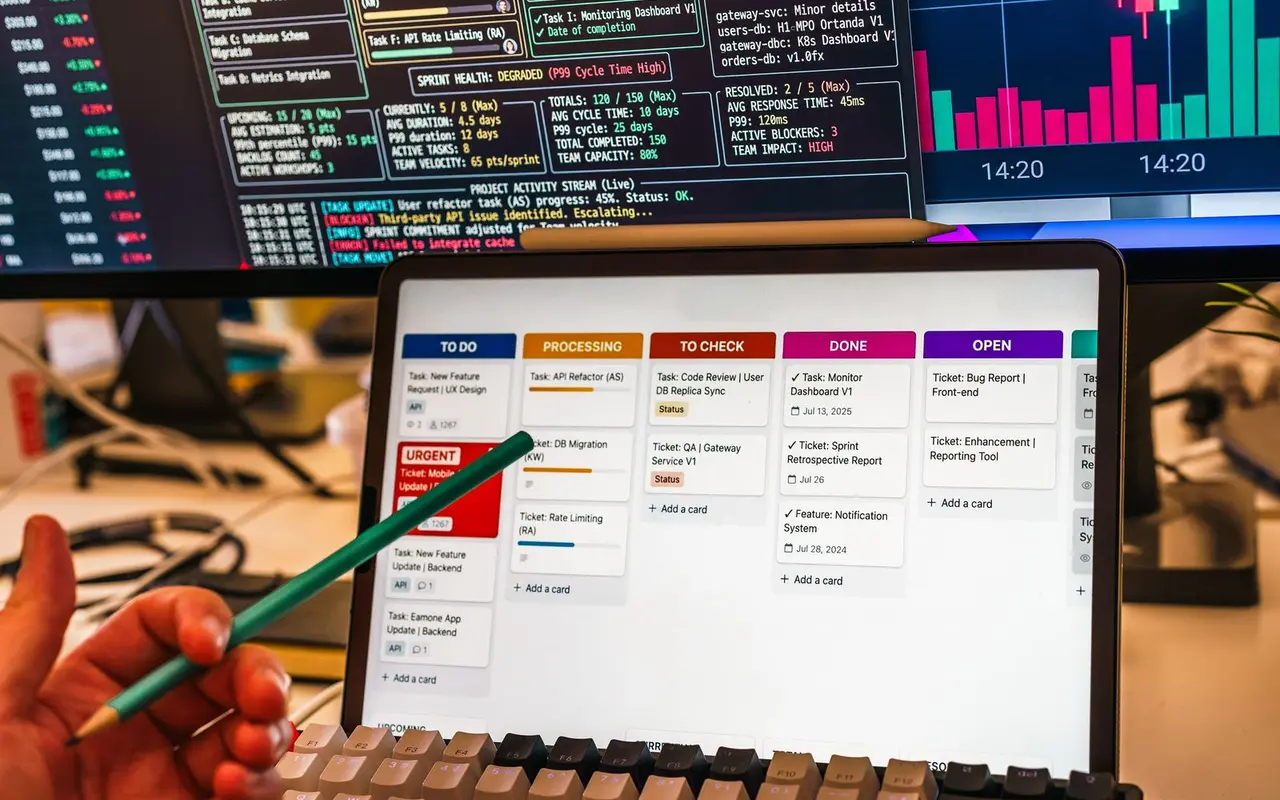
Spring Scanner It seeks instruments close to local extremes and structures that may precede reflection. Its aim is to discover: to find candidates for further analysis rather than predicting a certain bottom. Scanner evaluates price position in terms of, volume preservation, reflection dynamics and other quality features. A candidate with a high ranking can still continue to decline,...

  • First, define the context and horizon of the analysis.
  • Confirm your applications with independent data layers.
  • Take into account the quality of feed, spread and real cost of execution.
Read more
How HOSTuvo builds a ranking Top 10
HOSTuvo Lab4 min read

How HOSTuvo builds a ranking Top 10

Top 10 to solve the problem of overcapacity. Instead of looking at hundreds of pairs, the user receives a shorter list of instruments that meet more quality criteria at a given time and deserve manual verification. The ranking uses the results of scanners and models, but is not a simple list of the greatest increases. It's about structure, timing, fluidity, layer compatibility and possibility of...

  • First, define the context and horizon of the analysis.
  • Confirm your applications with independent data layers.
  • Take into account the quality of feed, spread and real cost of execution.

Read more
Dynamic Confluence: why the compatibility of many independent layers matters
HOSTuvo Lab4 min read

Dynamic Confluence: why the compatibility of many independent layers matters

Confluence only makes sense if it combines independent data families. Five indicators calculated from the same price do not provide five evidence. HOSTuvo compile, among others, the structure, PRE-MOVE, patterns, flow, derivatives and cross-market. Dynamic character means that the meaning of layers may depend on the regime. In the trend of moment and continuity may be more important, while in the range of...

  • First, define the context and horizon of the analysis.
  • Confirm your applications with independent data layers.
  • Take into account the quality of feed, spread and real cost of execution.
Read more
From scan to decision: full analytical process HOSTuvo step by step
HOSTuvo Lab4 min read

From scan to decision: full analytical process HOSTuvo step by step

Full process HOSTuvo The system splits the swing context, short-term timing, patterns, flow, derivatives and cost. First scanners create candidates. Then the regime and structure determine the environment, PRE-MOVE and Pattern Engine describe the change in dynamics, and Order Flow And the derivatives are looking for...

  • First, define the context and horizon of the analysis.
  • Confirm your applications with independent data layers.
  • Take into account the quality of feed, spread and real cost of execution.

Read more
Checklist of market analysis before the decision
Academy4 min read

Checklist before entering: 10 questions before you consider the setup ready

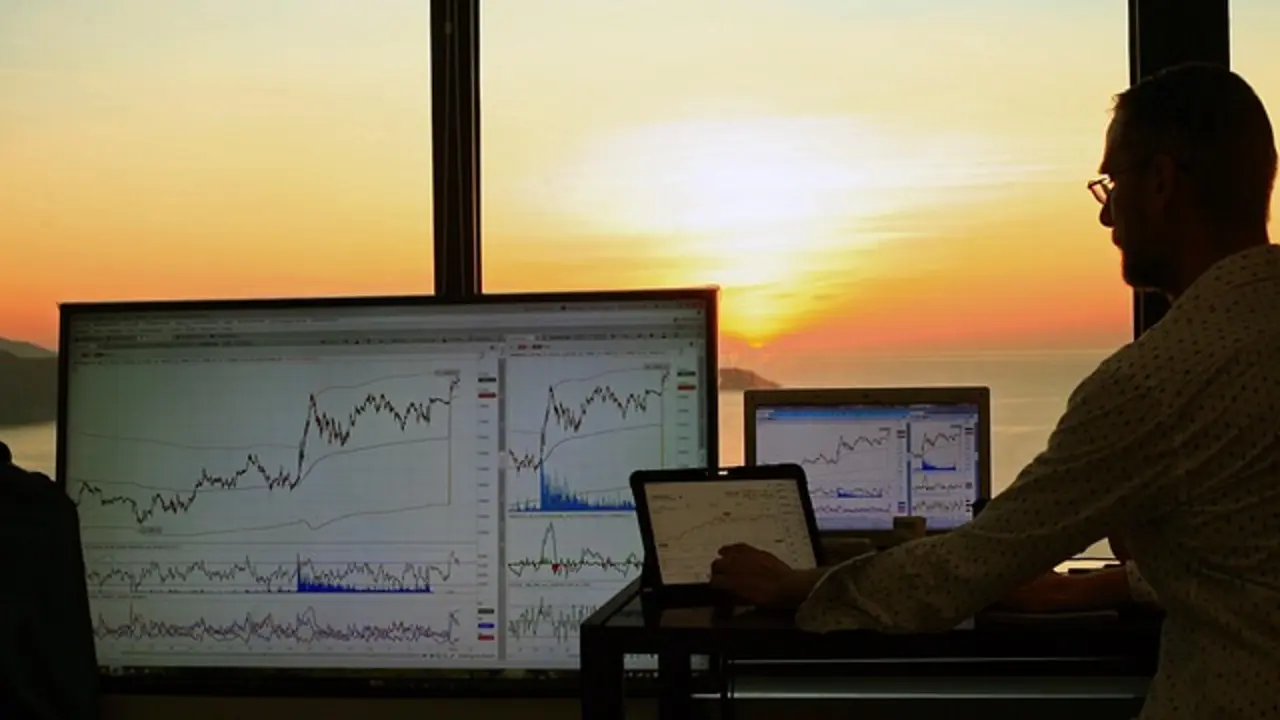
The easiest way to limit impulse decisions is to keep the checklist before entering. It is not to predict the market, but to force the same sequence of control regardless of emotion, result of the previous transaction and speed of movement. Good checklist includes market regime, horizon, structure, level of cancellation, liquidity quality, spread, compliance with BTC, behavior...

  • First, define the context and horizon of the analysis.
  • Confirm your applications with independent data layers.
  • Take into account the quality of feed, spread and real cost of execution.
Read more
Change in market sessions and impact analysis
Market sessions4 min read

Change Sessions and False Kicks: How to Read Passage Asia → London → New York

The transition between sessions is the moment when new participants and a different liquidity scale arrive in the market. Levels built in the quieter part of the day are then re-tested, so the first bump after opening London or New York is not always the target movement. The most important thing is to distinguish between level breach and acceptance of new prices. If the impact has volume, close...

  • First, define the context and horizon of the analysis.
  • Confirm your applications with independent data layers.
  • Take into account the quality of feed, spread and real cost of execution.

Read more
USA labour market data and crypto market analysis
Macros and Events4 min read

NFP and the US labour market: why crypto responds to employment

Data from the US labour market influence expectations about the economy and Fed policy, so NFP publications, unemployment rate and wage dynamics can quickly change the valuation of the dollar, bonds, indices and Bitcoina. The market does not respond to the very number of new jobs, but to the difference in expectations and consequences for future interest rates. Strong data can be...

  • First, define the context and horizon of the analysis.
  • Confirm your applications with independent data layers.
  • Take into account the quality of feed, spread and real cost of execution.
Read more
Level test after a chart
Price Action4 min read

Retest after knockout: When the return to level strengthens the setup

After an important level has been reached, the price often returns to the area that was previously resisting or supporting. The retest is not mandatory, but when it appears, it gives the opportunity to verify whether the market has actually accepted new prices and whether the other party has lost control. A qualitative retest should respect the area that was struck, show less pressure against the original impulse, and end...

  • First, define the context and horizon of the analysis.
  • Confirm your applications with independent data layers.
  • Take into account the quality of feed, spread and real cost of execution.
Read more
Order flow and market rate
Order Flow4 min read

Transaction rate and tape: what the acceleration of aggression says

Order flow is not only the direction of the delta. The pace of subsequent transactions, the size of aggressive orders and the speed at which the market consumes liquidity, can show a change in behaviour before it becomes obvious on a closed candle. Acceleration of the tape is of greatest importance at an important level. If aggressive buying quickly takes the ace and the price moves with it, demand has an effect...

  • First, define the context and horizon of the analysis.
  • Confirm your applications with independent data layers.
  • Take into account the quality of feed, spread and real cost of execution.

Read more
Order depth of the book and liquidity asymmetry
Liquidity and microstructure4 min read

Depth Imbalance: When the asymmetry of the order book matters

Depth Imbalance compares visible liquidity on the bid and ask side at a certain distance from the price. It can indicate that one page of the sheet is at the moment much thicker, but without observing changes in time it is easy to confuse a real advantage with an impermanent declaration of orders. Asymmetry is more valuable when it persists at the price approximation, appears in several depth ranges and...

  • First, define the context and horizon of the analysis.
  • Confirm your applications with independent data layers.
  • Take into account the quality of feed, spread and real cost of execution.

Read more
Futures contracts and crypto market base analysis
Derivatives4 min read

Basis futures, contango and backwardation: what they say about leverage demand

The difference between the price of the futures and the spot market is called basis. When futures trade higher than the spot, we have contango; when lower — backwardation. This relationship helps to assess the cost of the forward exposure and the behaviour of participants using leverage. High positive basis may indicate strong demand for long exposure or cost of capital, and negative basis appears more often in...

  • First, define the context and horizon of the analysis.
  • Confirm your applications with independent data layers.
  • Take into account the quality of feed, spread and real cost of execution.

Read more
Model validation HOSTuvo and analysis of prediction errors
HOSTuvo Lab4 min read

How HOSTuvo bill false positives and missed moves

The system learning only on the signals quickly creates a false picture of its effectiveness. HOSTuvo must record both the wrongly indicated situations and the large movements that the scanner has not noticed, because both types of errors describe a different part of the quality selection. False positive speaks of precision: the candidate has been shown, but the move has not met later criteria. Missed move...

  • First, define the context and horizon of the analysis.
  • Confirm your applications with independent data layers.
  • Take into account the quality of feed, spread and real cost of execution.
Read more