ACADEMY
Trend, range or transition: recognising the market regime
The same technical signal is of different importance in a stable trend, in a tight range and during a rapid change of conditions. Therefore, the first task of an analyst is to name the environment in which he works.
The same technical signal is of different importance in a stable trend, in a tight range and during a rapid change of conditions. Therefore, the first task of an analyst is to name the environment in which he works. In the market analysis, the most important is the repetitive method: first the context, then the evidence and finally the conditions of performance. A single observation may draw attention to the market, but should not replace the full process.
What Is Really Worth Watching
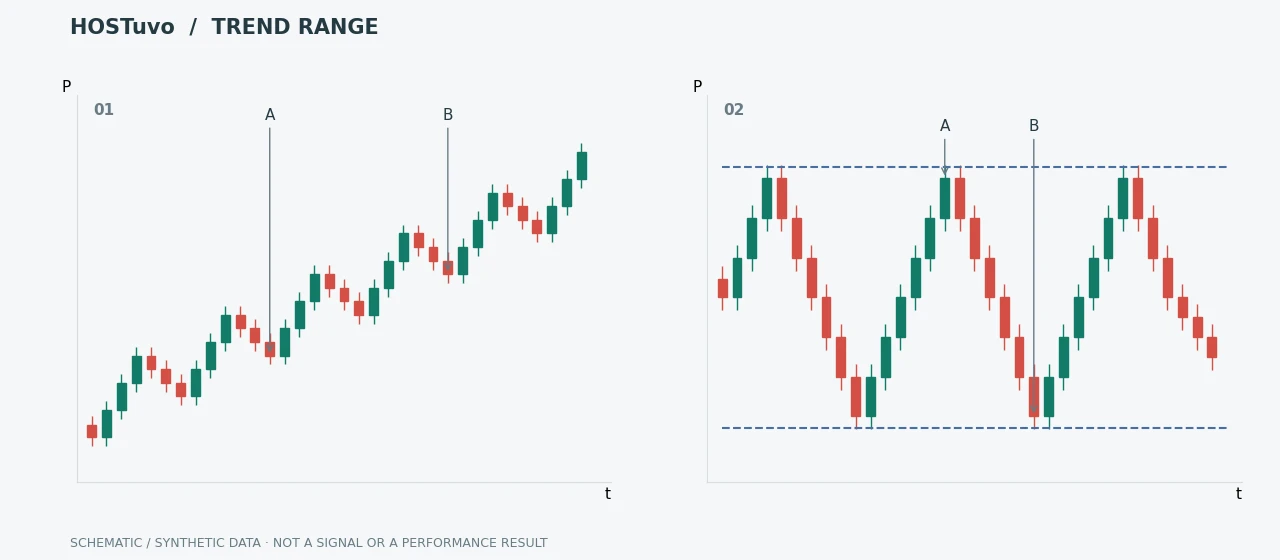
The trend is characterised by a structured sequence of winds and relatively coherent directional pressure. The range requires more attention to the edges of the range, and chaos or transition means that historical relationships quickly lose stability. It is not about finding one number that determines the situation, but about understanding the mechanism and conditions in which the information becomes useful.
How to Read It in Practice
Check the price relative to moving averages and key swing points, the width of the range, volatility, the frequency of false breakouts, and behaviour during session changes. Do not try to force the market to be assigned to one box when data indicates a transition condition. It is worth saving the criteria before moving and after time to check if they were actually met. Only then can you distinguish a useful signal from a story matched to the fact and improve the process based on data.
Most common error
The strategy of the race can generate a series of false entrances in the range, and aggressive mean reversion can be swept away by trend. Under greater volatility and time pressure, it becomes easier to mistake an interesting observation for a tested edge. Therefore, the condition for cancellation, the quality of the data and the cost of entry should be determined before the decision is made.
How HOSTuvo incorporates this context into the process
Regime Brain in HOSTuvo it classifys the market as a layer of context. It is not a standalone signal, but it affects how the system interprets other information and whether a combination of layers is at all comparable to previous observations. HOSTuvo does not submit automatic orders and does not guarantee the result. Research layers are settled after time, and the new model must be validated before it obtains the production impact.
Describe behaviour before assigning a label
A regime is a summary of several observations, not a property permanently attached to a coin. Separate direction, realised variability and persistence. A market can trend steadily with narrow candles, or move sideways with large swings. Compare successive swing highs and lows, time spent outside the prior range and the size of pullbacks relative to preceding advances. Label uncertain transitions explicitly. If every brief interruption is called a reversal, the classification will change faster than any subsequent evaluation can resolve it.
Hypothetical trend that becomes less coherent
Imagine successive highs at 100, 103 and 106, with lows at 98, 101 and 104. A decline from 106 to 104.5 does not yet break that rising sequence. If later rebounds stop at 105 and 104 while the floor remains 104, the structure is compressing rather than continuing cleanly. A break below 104 would change the evidence again. These numbers describe an example, not automatic entry thresholds. The useful output is a changing set of conditions that explains why the same momentum reading can deserve different treatment.
Evaluate regimes without rewriting their history
Record the label that was available at each decision, together with the features used to produce it. Do not redraw old regime boundaries after seeing the next trend and then calculate performance on the improved map. Compare results within sufficiently large time blocks, and retain a transition category instead of forcing every difficult period into trend or range. If a rule works only in one recent rally, report that scope. A stable classification is useful only when its delay and occasional mistakes are visible alongside its apparent explanatory power.
Example chart pattern
Sources and example scope
The references explain the underlying definitions and mechanisms. Numerical scenarios are hypothetical teaching examples, not forecasts or reported HOSTuvo returns.
IN HOSTuvo
See this context in the live terminal.
Regime Brain in HOSTuvo it classifys the market as a layer of context. It is not a standalone signal, but it affects how the system interprets other information and whether a combination of layers is at all comparable to previous observations.