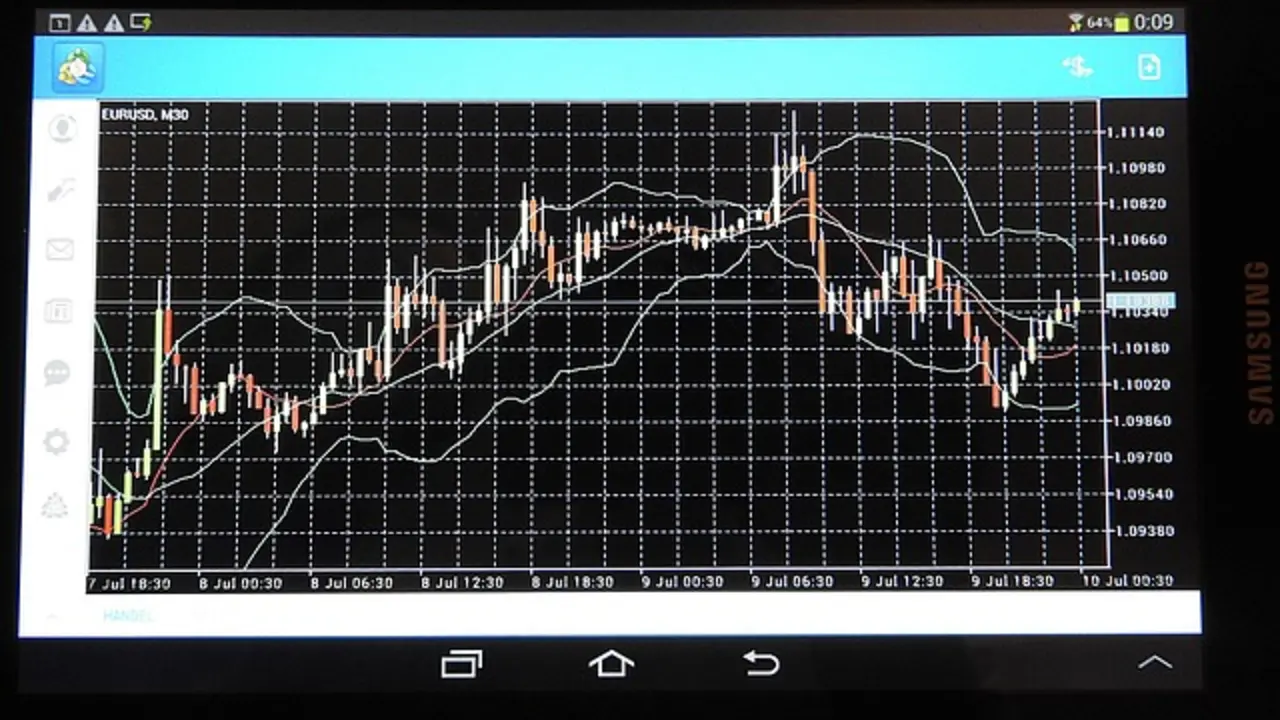
PRICE ACTION
Support and resistance: reference zones and invalidation
The level of support or resistance is not a single ideal price. This is an area where demand and supply have previously changed significantly, either activity has increased or the market has reacted repeatedly.
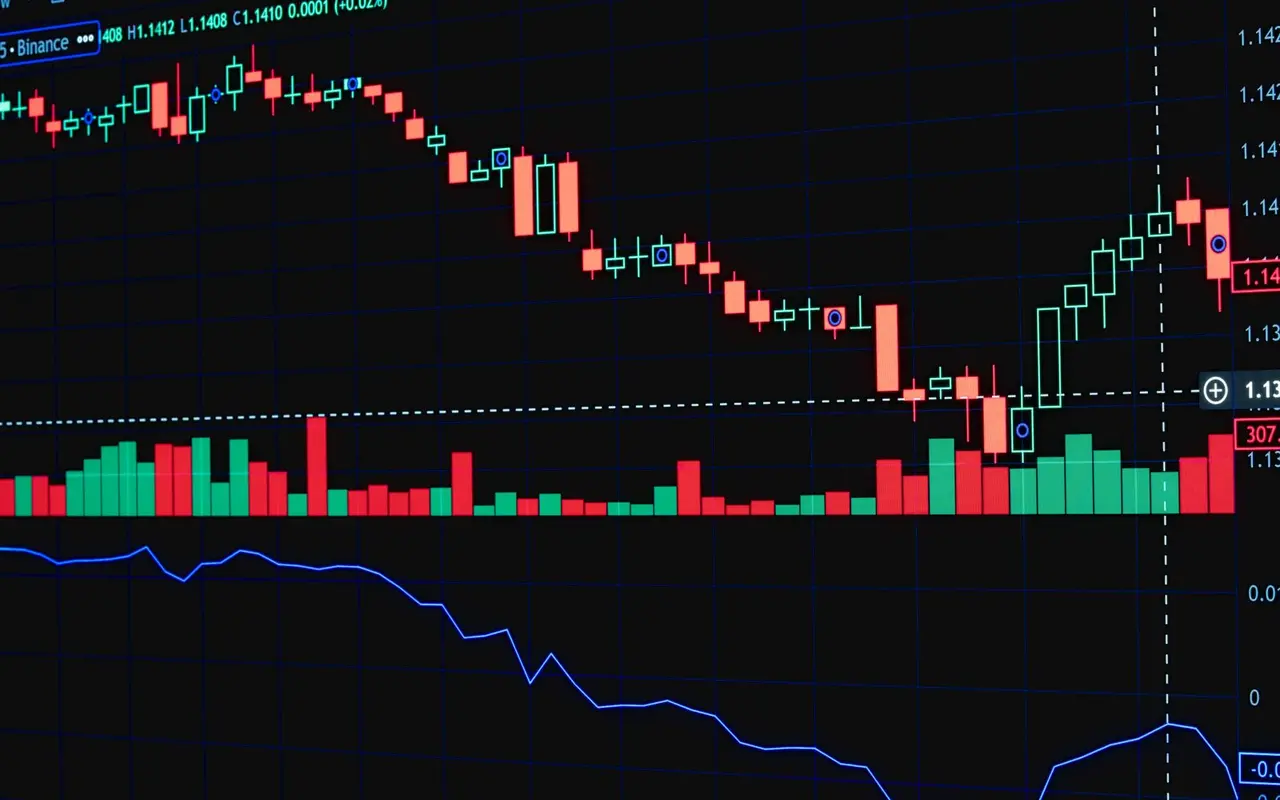
The level of support or resistance is not a single ideal price. This is an area where there has previously been a significant change in the balance of demand and supply, either activity or market has repeatedly reacted. In market analysis, the most important is the repetitive method: first the context, then the evidence and at the end of the performance conditions. A single observation may draw attention to the market, but should not replace the full process.
What Is Really Worth Watching
The most important are the levels seen at the higher interval, the limits of the well defined range, the earlier high/low swing and the place of the large volume. The more independent reasons, the greater the chance that the market will pay attention to the zone. It is not about finding one number that settles the situation but about understanding the mechanism and conditions in which the information becomes useful.
How to Read It in Practice
Select zones, not thin lines. Check the reaction on the first and subsequent tests, because multiple touching can consume fluidity. Use candle closures and flow to evaluate acceptance. It is worth saving the criteria before moving and after time to check if they were actually met. Only then can you distinguish a useful signal from a story matched to the fact and improve the process based on data.
Most common error
This is a step-by-step error to fit the graph. This matching prevents the process from assessing the quality of the process. The levels should be determined before the reaction and the rules of their validity as constant as possible. Under greater volatility and time pressure, it becomes easier to mistake an interesting observation for a tested edge. Therefore, the condition for cancellation, the quality of the data and the cost of entry should be determined before the decision is made.
How HOSTuvo incorporates this context into the process
HOSTuvo combines structure levels with flow layers and Execution GateThe mere presence of the price on support does not mean entry; the system checks whether confirmation is available and whether the potential plan makes sense after taking into account the cost. HOSTuvo does not submit automatic orders and does not guarantee the result. Research layers are settled after time, and the new model must be validated before it obtains the production impact.
Use zones with an explicit construction rule
A level can come from a prior swing, a range boundary or a repeatedly traded area, but those choices are not interchangeable. State how the zone was selected and what would make it obsolete. The width should reflect the price scale, tick size and recent variability instead of the thickness of a line drawn on a chart. Repeated touches do not automatically strengthen support: they may indicate persistent interest or gradual consumption of resting demand. Observe the response at each test rather than assuming the meaning of the count.
Hypothetical support test
A market previously rebounded from 49.80–50.00. It later returns to the zone with larger sell trades but smaller downward progress, then trades back above 50.00. This differs from a fast passage through 49.80 followed by failed attempts to recover it. The first sequence raises a question about absorption; the second weakens the support hypothesis. Neither can reveal unseen orders or guarantee a bounce. The useful distinction is between an observed response and a level whose importance was assumed only because it looked neat on a historical chart.
Keep a level stable long enough to evaluate it
Record the zone before the next test, together with the relevant timeframe and invalidation condition. If you move it after every overshoot, the level becomes impossible to falsify. Review the distance to the next opposing zone and the cost of entering, rather than assigning a target solely from a pattern's height. Compare successful reactions, clean failures and unresolved visits. A practical support map should help explain where a scenario stops making sense; it should not turn every nearby price into a reason to preserve the same directional opinion.
Example chart pattern
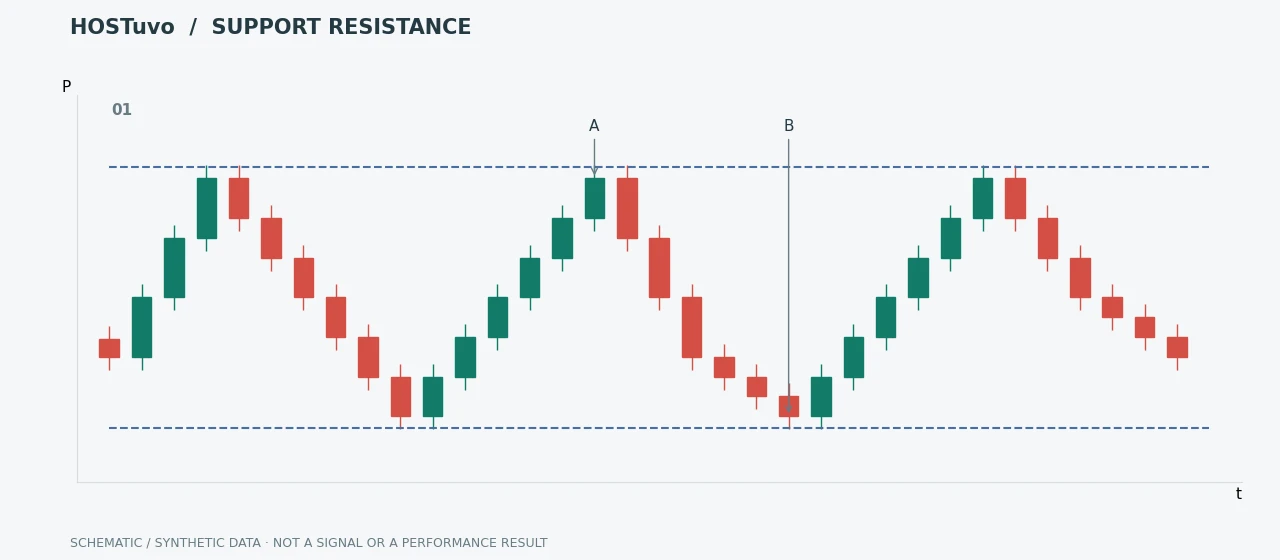
Sources and example scope
The references explain the underlying definitions and mechanisms. Numerical scenarios are hypothetical teaching examples, not forecasts or reported HOSTuvo returns.
IN HOSTuvo
See this context in the live terminal.
HOSTuvo combines structure levels with flow layers and Execution GateThe mere presence of the price on support does not mean entry; the system checks whether confirmation is available and whether the potential plan makes sense after taking into account the cost.