PRICE ACTION
Breakout or fakeout: testing acceptance beyond a range
Compare a crypto breakout with a false break using price acceptance, retests, liquidity and costs. A wick beyond resistance is not sufficient evidence.
A breakout describes price moving beyond a reference range or level. Calling that move sustainable requires a defined observation window and evidence that arrives afterwards. This distinction matters: hindsight can make a failed break look obvious even when the live information was ambiguous.
Define the level and the time frame first
Treat a reaction area as a zone rather than a price with magical precision. State which closed candles define the range and which interval will be used to evaluate a break. For a hypothetical range from 98 to 102, a trade at 102.1 establishes only that the upper boundary was crossed. It does not establish where the next candle will close or whether new buyers will continue to participate.
Look for acceptance and an explicit failure condition
One way to frame the investigation is to ask whether price stays beyond the zone, whether a pullback holds near it, and what would invalidate the scenario. These observations are alternatives to chasing the first spike, not a universally profitable entry rule. A rapid return inside the original range contradicts a continuation hypothesis. A retest can also fail, so it should not be treated as a guarantee.
Compare executed activity with displayed liquidity
Trade flow shows completed transactions; an order-book snapshot shows currently displayed resting orders. A large visible wall can change before it is traded. Check the feed timestamp and whether the apparent breakout comes from the reference market or the venue used for execution. Missing order-book updates or a temporarily wide spread can distort the interpretation of a small price move.
Keep the test honest after the outcome
Save the original level, horizon, estimated costs and failure condition. Evaluate later without extending the target window whenever the first result is disappointing. A candle touching a target does not prove an order of your intended size could fill there. In HOSTuvo, a scanner candidate and a tactical observation are inputs to verification. Neither a high score nor a chart pattern is a promise that the break will continue.
Define a breakout before observing its result
Specify the reference range, timeframe and what counts as a completed break. A wick, a closed candle and several minutes of trading outside the range represent different conditions. Record how far price has already travelled when the observation becomes available. A setup identified after an extended candle may describe a real breakout while offering a poor entry. This separates pattern recognition from timing. The evaluation should retain both successful and failed breaks under the same original definition instead of calling every failed example a different pattern.
Hypothetical two-stage comparison
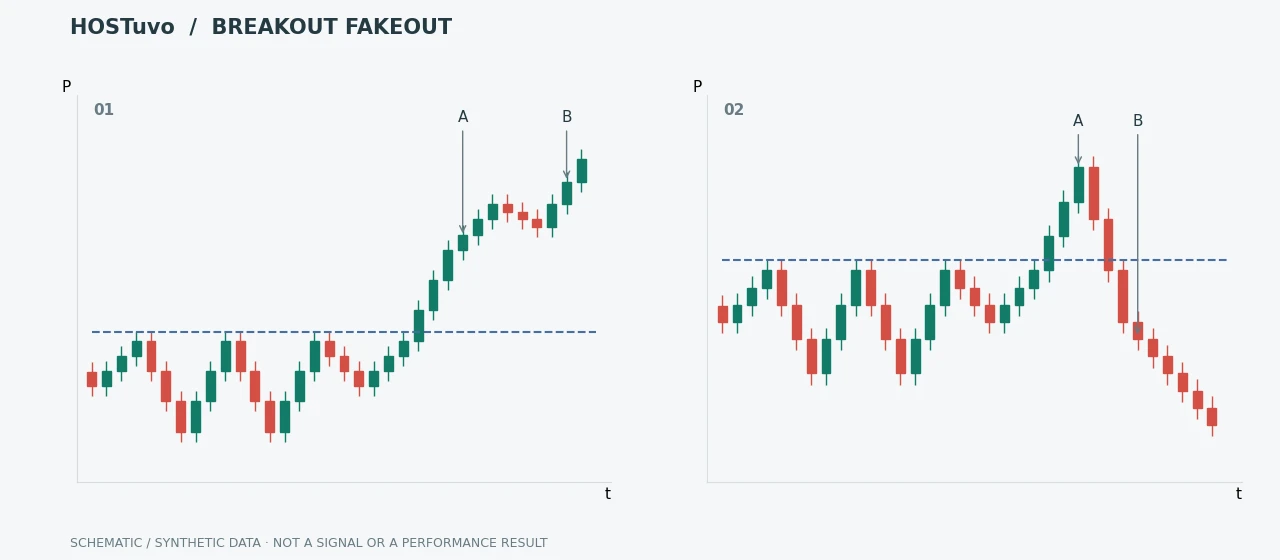
Consider resistance at 100.00. Price trades at 100.30 but closes at 99.90; that is a rejection under a closed-candle rule. On another occasion it closes at 100.20 and returns to 100.00 while sell trades fail to push it back inside the range. The second path supplies additional evidence of acceptance, but still leaves execution cost and invalidation to check. A later advance does not permit you to pretend entry occurred at 100.00 if your confirming observation was only available at 100.25.
Review why the break failed
Separate a weak underlying scenario from a delayed alert, a stale quote or an expensive fill. Inspect whether participation grew beyond the boundary or only a few thin-book trades printed there. When the level is reclaimed in the opposite direction, use the previously defined failure condition rather than adding more tolerance indefinitely. Compare results by volatility and session, but do not choose the best subgroup after seeing outcomes and present it as a universal edge. A reliable checklist describes observable conditions, not an assurance that false breaks can be eliminated.
Example chart pattern
Sources and example scope
The references explain the underlying definitions and mechanisms. Numerical scenarios are hypothetical teaching examples, not forecasts or reported HOSTuvo returns.
IN HOSTuvo
See this context in the live terminal.
Read the scanner, chart and execution conditions together. An unconfirmed candidate remains a candidate even when its chart looks convincing.