PRICE ACTION
Volatility compression: recognising a smaller range without guessing its exit
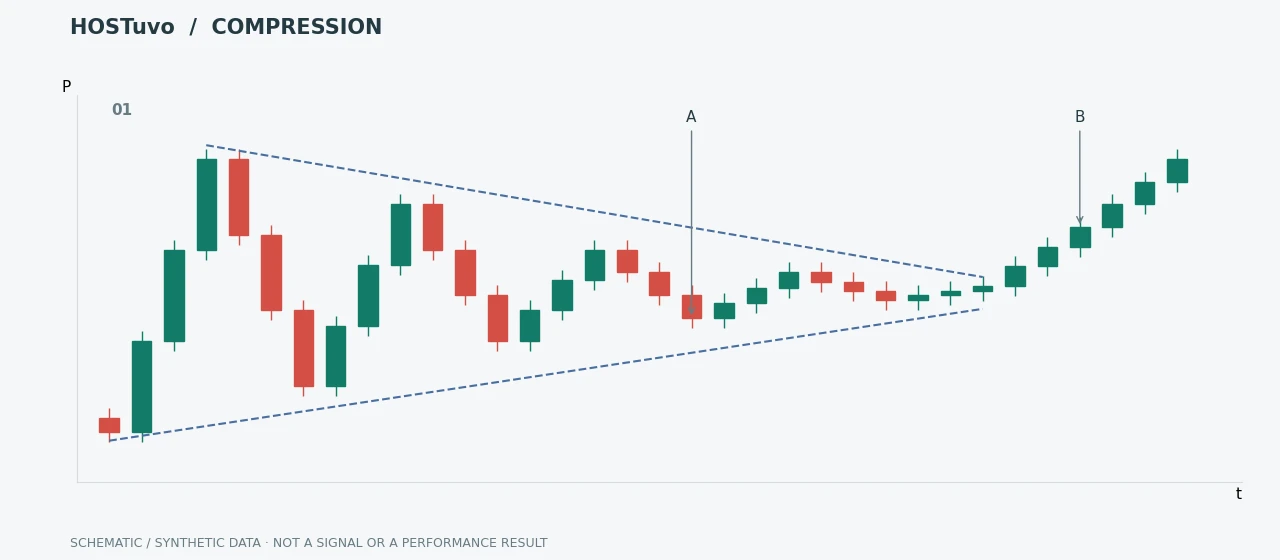
Compression means a decrease in traffic range and often collecting orders on both sides of the market. However, it does not tell which direction the expansion will take. Its value is that the current state may be unstable.
Compression means a decrease in traffic range and often collecting orders on both sides of the market. However, it does not tell which direction expansion will take. Its value is that the current state may be unstable. In market analysis, the most important is the repetitive method: first the context, then the evidence and at the end the conditions of execution. A single observation may draw attention to the market, but should not replace the full process.
What Is Really Worth Watching
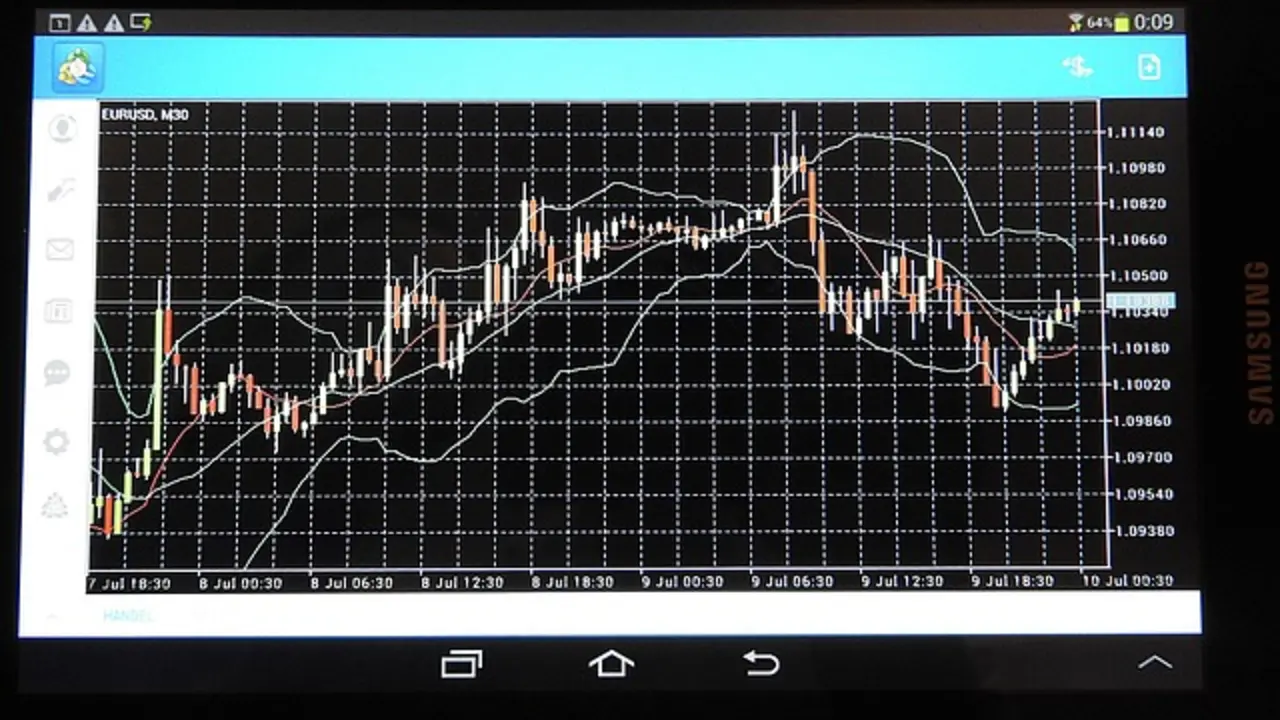
It can be observed by Bollinger narrowing, ATR drop, tight range, decreasing spread of traffic between swings and order thickening. It is important to see whether compression is accompanied by an increasing volume or asymmetry flow. It is not about finding one number that determines the situation, but about understanding the mechanism and conditions in which the information becomes useful.
How to Read It in Practice
Select the compression limits and wait for acceptance outside the range. Trying to predict the direction before confirmation can be costly: a price may break out briefly and return to its range before a sustained expansion occurs. It is worth saving the criteria before moving and after time to check whether they were actually met. Only then can you distinguish a useful signal from a story matched to the fact and improve the process based on data.
Most common error
The mistake is to buy the very fact that “Bollinger is narrow”. Compression can take long and the knock without participation quickly return to the range. Confirming direction and real demand/supply is needed. Under greater volatility and time pressure, it becomes easier to mistake an interesting observation for a tested edge. Therefore, the condition for cancellation, the quality of the data and the cost of entry should be determined before the decision is made.
How HOSTuvo incorporates this context into the process
PRE-MOVE and Pattern Engine HOSTuvo They may mean an increasing expansion, but they should not guess the direction without evidence. Dynamic Confluence assess whether flow, trend and cross-market support a specific page. HOSTuvo does not submit automatic orders and does not guarantee the result. Research layers are settled after time, and the new model must be validated before it obtains the production impact.
Measure contraction relative to the same market
Compression describes reduced variation, not a guaranteed expansion or a known direction. Compare recent true ranges, realised returns or band width with a prior reference for the same pair and timeframe. State the lookback explicitly. A small candle in a normally quiet pair may be ordinary, while the same percentage range is exceptional in a volatile one. Compression can end gradually, continue longer than expected, or resolve with false breaks. A low range reading should prompt investigation of a potential transition rather than force an entry.
Hypothetical range contraction
Suppose the median one-minute range falls from 0.20% to 0.08% while price remains between 25.00 and 25.20. A print at 25.23 is outside the range, but may still be small relative to ordinary volatility. If the book is thin, that excursion could be produced by little executed volume. Record whether subsequent closed candles maintain the new area and whether execution remains affordable. The example shows why the relative size of a breakout and the surrounding liquidity matter more than the visual narrowness of the preceding candles.
Keep the time-to-resolution question separate
For each compression candidate, record when the condition first became observable and how long it lasted before the predefined exit event. Include cases that remain unresolved at the end of the window. Do not begin the timer at the tightest candle selected after the eventual move. Compare direction forecasts separately from forecasts of increased movement: predicting that something may happen is not the same as predicting which side wins. This distinction is especially useful when evaluating a scanner that produces both event scores and directional context.
Example chart pattern
Sources and example scope
The references explain the underlying definitions and mechanisms. Numerical scenarios are hypothetical teaching examples, not forecasts or reported HOSTuvo returns.
IN HOSTuvo
See this context in the live terminal.
PRE-MOVE and Pattern Engine HOSTuvo They may mean an increasing expansion, but they should not guess the direction without evidence. Dynamic Confluence assess whether flow, trend and cross-market support a specific page.