PRICE ACTION
Bull and bear flags: continuation candidates, not guarantees
The flag is a structure of consolidation after the pulse that may precede the continuation, but only if the previous move was qualitative and correction does not destroy its structure. The parallel channel itself on the chart is not enough.
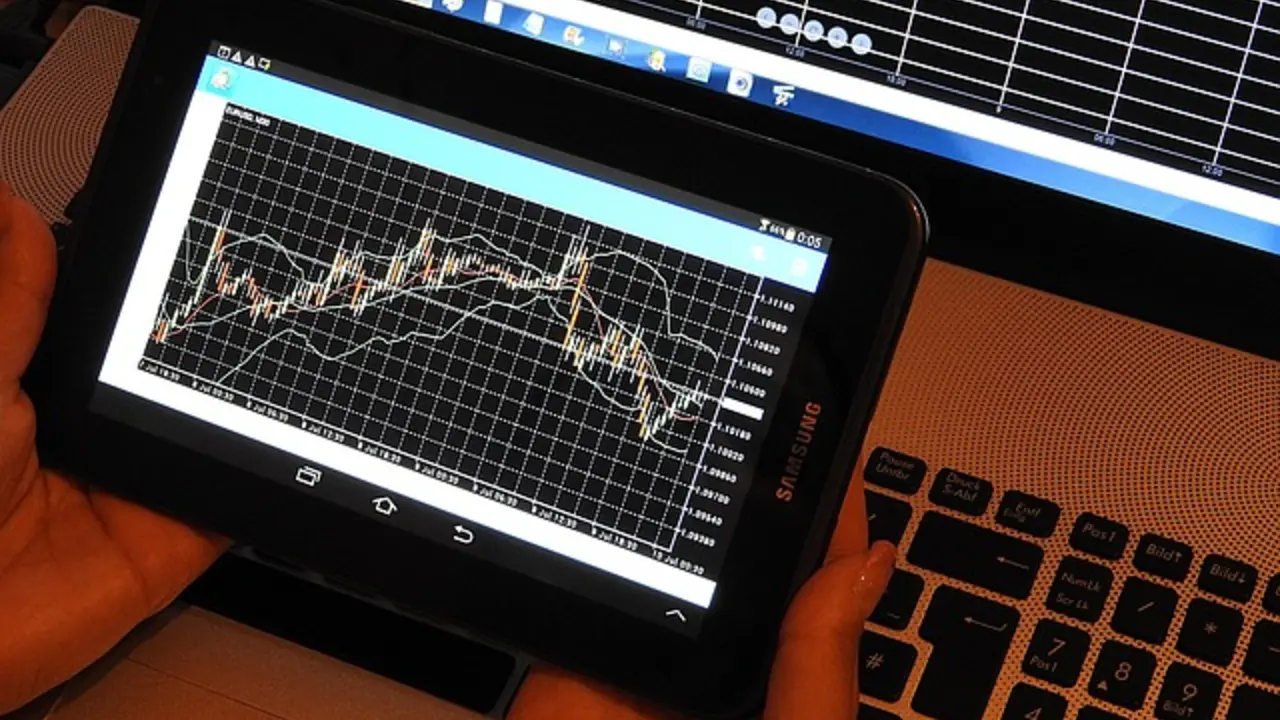
The flag is a structure of consolidation after the impulse that may precede the continuation, but only if the previous movement was qualitative and correction does not destroy its structure. The parallel channel itself on the chart is not enough. In market analysis, the most important is the repetitive method: first context, then evidence and finally performance conditions. A single observation may draw attention to the market, but should not replace the full process.
What Is Really Worth Watching
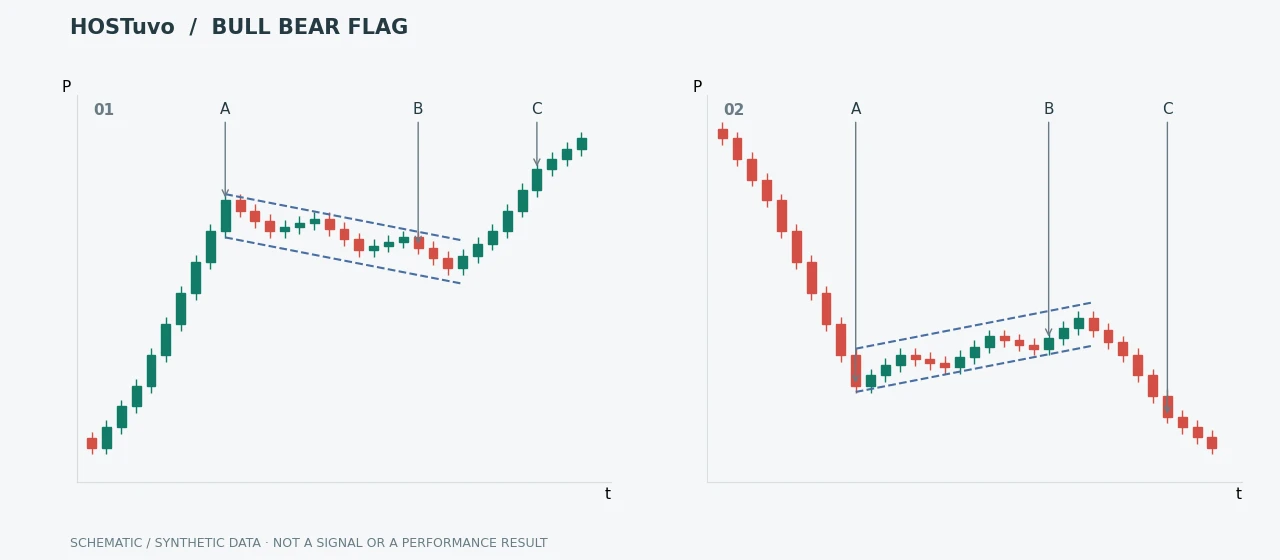
In Bull Flag we are looking for an orderly correction of less time than the impulse, maintaining key levels and returning demand at the attempt to strike. Bear Flag works analogously on the supply side. It is not about finding one number that determines the situation, but about understanding the mechanism and conditions in which the information becomes useful.
How to Read It in Practice
Compare pulse volume with correction volume, depth of the undo, relation to VWAP/EMA and behavior at the flag border. The best setups do not require a very wide stop relative to the expected movement. It is worth saving the criteria before moving and after time to see if they were actually met. Only then can you distinguish a useful signal from a story matched after the fact and improve the process based on data.
Most common error
If the correction has an equally aggressive flow against the impulse or the market returns deep into the previous structure, the advantage of continuation decreases. Under greater volatility and time pressure, it becomes easier to mistake an interesting observation for a tested edge. Therefore, the condition for cancellation, the quality of the data and the cost of entry should be determined before the decision is made.
How HOSTuvo incorporates this context into the process
HOSTuvo detects flags as patterns but aligns them with the regime, PRE-MOVE and flow. Formation in accordance with trend may get higher attention, but still does not bypass cost, spread or conditions Precision Gate. HOSTuvo does not submit automatic orders and does not guarantee the result. Research layers are settled after time, and the new model must be validated before it obtains the production impact.
Define the impulse and the pause separately
A flag interpretation begins with a directional impulse followed by a contained consolidation. Describe the impulse's size and duration, the pause's range and the fraction of the move retraced. These measurements are more useful than insisting on a perfectly tilted rectangle. A deep, erratic reversal may no longer resemble a controlled pause even if a channel can still be drawn around it. The structure is a hypothesis about continuation; it does not explain who owns the resting liquidity or establish a fixed chance of success.
Hypothetical bullish continuation candidate
Imagine an advance from 100 to 106 followed by trading between 103.8 and 105.0. The pause retraces part of the impulse while staying above its origin. A subsequent close above 105.0 gives different information from a brief wick through it. If the consolidation expands down to 100.5, the original compact-pause thesis weakens. A projected repetition of the six-unit impulse is only an illustrative scenario. The relevant entry is the quote available after your confirmation, not the lowest price inside the completed flag.
Avoid selecting only attractive historical drawings
Write down the maximum pause duration, invalidation boundary and confirmation rule before reviewing outcomes. Include consolidations that break against the initial impulse and those that never resolve. Compare price progress with trading activity and check whether the remaining distance to nearby resistance still justifies the cost. For a bearish mirror, remember that identifying downward pressure does not itself make a short position available on a spot account. Market interpretation and the set of instruments a user may actually trade must remain separate.
Example chart pattern
Sources and example scope
The references explain the underlying definitions and mechanisms. Numerical scenarios are hypothetical teaching examples, not forecasts or reported HOSTuvo returns.
IN HOSTuvo
See this context in the live terminal.
HOSTuvo detects flags as patterns but aligns them with the regime, PRE-MOVE and flow. Formation in accordance with trend may get higher attention, but still does not bypass cost, spread or conditions Precision Gate.