Market analysis
Bitcoin Market Analysis Tools: Build a Clear Research View
Build a Bitcoin analysis workflow around price structure, execution, multiple timeframes and costs. Use BTC context carefully when researching altcoins.
This guide is currently available in English. The language menu opens the homepage in your selected language.
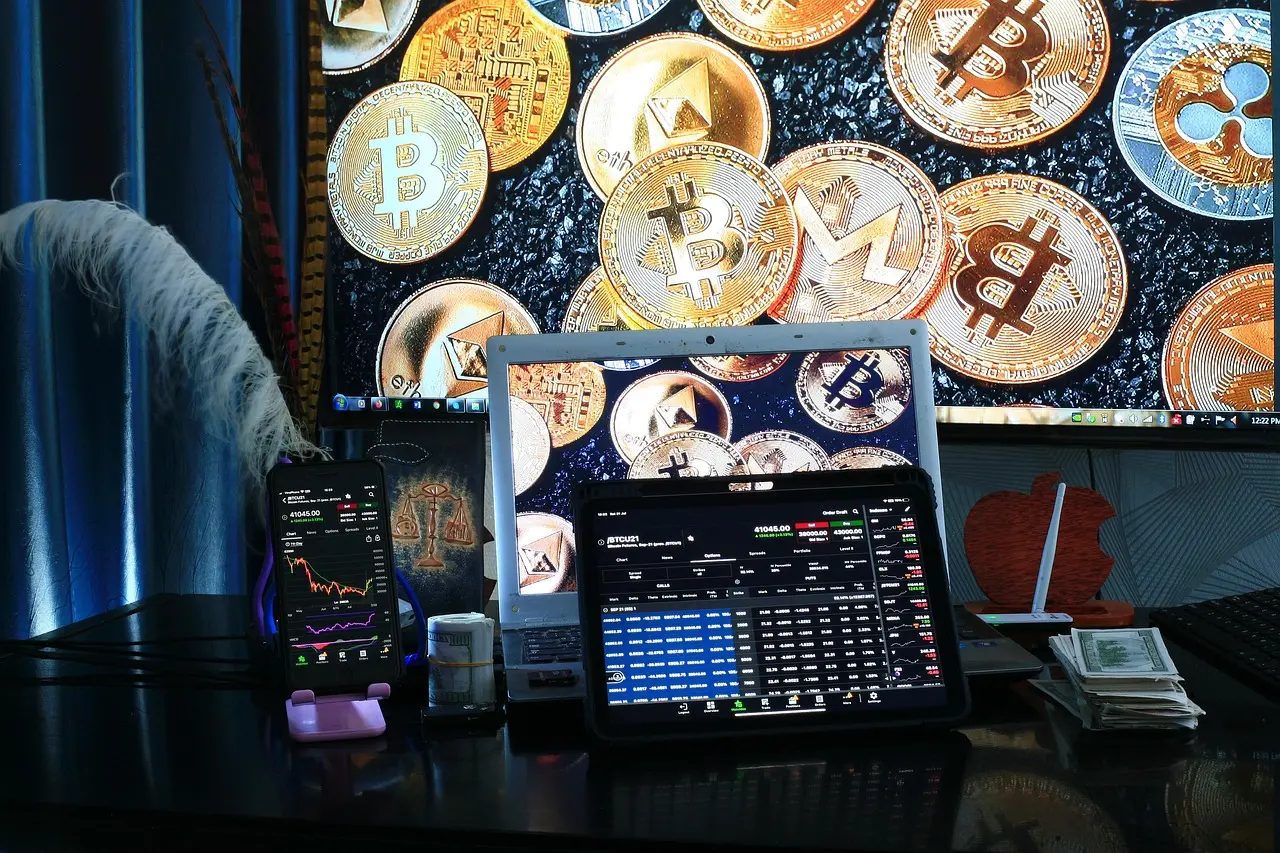
Bitcoin is both a market to analyze on its own and a useful reference when researching other crypto assets. A clear research view combines structure, timing, available execution evidence and data quality. HOSTuvo brings these perspectives into a connected terminal workflow.
Choose the question before choosing the tool
A Bitcoin chart can answer several different questions: where the market is trading within its recent range, how a broader trend is developing or whether a brief move has supporting activity. Decide which question matters and choose a horizon. A tool is useful when its inputs and output match that question, not simply because it contains a large number of indicators or an impressive-looking score.
Confirm the instrument before reading the result. Bitcoin spot, a perpetual contract and a pair quoted in another currency are related but different markets. Keep the exchange, quote asset and timestamp visible in your research. HOSTuvo's spot-focused context should be interpreted on its own terms rather than silently extended into claims about every derivative or every venue where Bitcoin is traded.
Build a price-structure view across suitable horizons
Begin with the surrounding structure: recent extremes, the current range and areas where price previously changed behavior. Use a broader view to establish context, then a shorter view to examine the movement near the level you are studying. A level is a research reference, not a promise that the market will stop there. Price can pass through it, pause temporarily or return after an initial break.
In HOSTuvo, read the broader 4h/1d assessment separately from PRE-MOVE's tactical context. A short rebound can develop while the surrounding picture remains uncertain. Note both observations and the condition that would change your interpretation. This produces a more useful plan than taking a favorable short reading as proof that every wider concern has disappeared.
Add execution evidence and realistic costs
Where the relevant data is available, inspect Order Flow to understand recent execution around the price structure. Trade-based measures such as CVD and resting order-book imbalance describe different things. Read them with the venue and interval attached. Aggressive buying alongside stalled price raises a question about absorption, but it does not prove a particular actor's intention or guarantee a reversal.
Check spread, likely execution friction and fees before treating a small anticipated movement as meaningful. A well-known asset does not remove the need to consider the exact pair and order size. Use explicit assumptions in the cost calculator, and revise them if market conditions change. A price move in the expected direction can still leave an unfavorable result after the full round trip.
Use Bitcoin as context without inventing causation
When researching an altcoin, compare its movement with Bitcoin over the same interval. The comparison can show whether the asset is participating in a broad move or behaving differently. It cannot establish that Bitcoin caused the altcoin's change or that the relationship will persist. Correlations can vary across periods, instruments and market conditions, especially when a coin has its own event or liquidity shock.
Separate a benchmark observation from a predictive claim. An altcoin holding its price while Bitcoin falls may deserve attention, but the difference could reflect stronger demand, delayed adjustment, thin trading or a mismatched feed. Investigate the chart and available activity instead of assigning a bullish conclusion automatically. Consistent timestamps and comparable quote currencies make the comparison more interpretable.
Explore a hypothetical relative-strength comparison
Imagine Bitcoin declines 1% during a chosen hour while a fictional altcoin rises 0.3%. The altcoin has a 1.3 percentage-point return advantage in that simple comparison. This is not a calculated correlation, proof of independence or a forecast. The two instruments may have very different volatility and execution conditions, and the advantage may disappear as the observation window changes.
Review what produced the difference. Was the altcoin actively traded, close to a significant level or temporarily affected by a few small executions? What happens to the assessment if you compare the broader timeframe? Record the answers and estimated costs before deciding whether the candidate deserves further study. These invented numbers illustrate comparison arithmetic and are not current market data.
Create a repeatable Bitcoin research routine
Use a compact sequence: verify market identity and freshness, read the broad structure, inspect tactical behavior, add available flow context and review costs. If you are evaluating another asset, add the matched Bitcoin comparison as a separate step. HOSTuvo helps organize those perspectives within a shared workflow so you can spend more attention interpreting evidence and less rebuilding the same market context.
Finish with a documented uncertainty and a review time. Keep HOLD observations in the record and compare the later outcome with the original horizon. A useful analysis tool should make its limitations easier to understand, including stale inputs and research-only outputs. Explore the terminal and supporting guides to assess whether this way of working fits your own process before making any financial decision.
Sources and editorial approach
Prepared with AI assistance for HOSTuvo Editorial. Source links support the explanations; they do not endorse HOSTuvo or certify a trading result. Educational examples are hypothetical and are not live trading instructions.